Featured Open Source
I'm passionate about open source because I fundamentally believe in the radical power of transparent and open knowledge making. Here are some of the projects I've worked on the most.
reviz

A lightweight engine for generating partial Observable Plot programs from SVG subtrees.
cartokit

A direct manipulation programming environment for interactive cartography on the web.
renature

A physics-based animation library for React focused on modeling natural world forces.
rescript-urql
ReScript bindings for Formidable's Universal React Query Library, urql.
urql
The highly customizable and versatile GraphQL client with which you add on features like normalized caching as you grow.
webpack-dashboard
A CLI dashboard for webpack dev server
Contributions
When I'm not doing research or teaching, I love contributing to open source. Here are the stats for my contributions over the past year.
89
Commits
34
Pull Requests
14
Pull Request Reviews
10
Issues
Projects
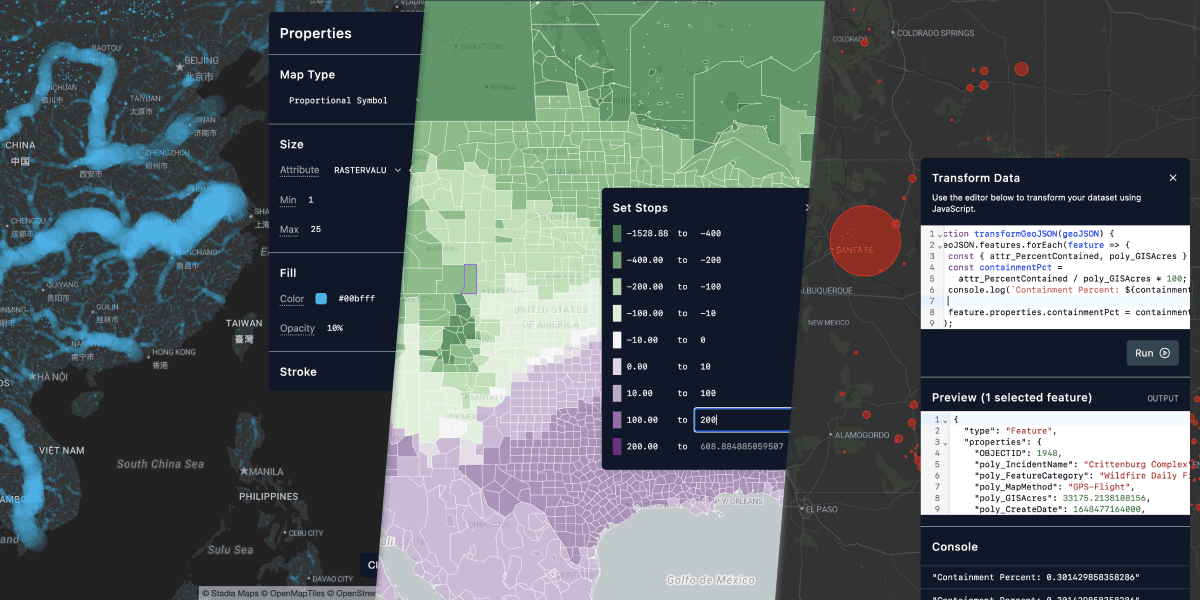
cartokit
cartokit is a direct manipulation programming environment for interactive cartography on the web. Style geospatial data via intuitive direct manipulation controls while the cartokit compiler writes the corresponding JavaScript code.
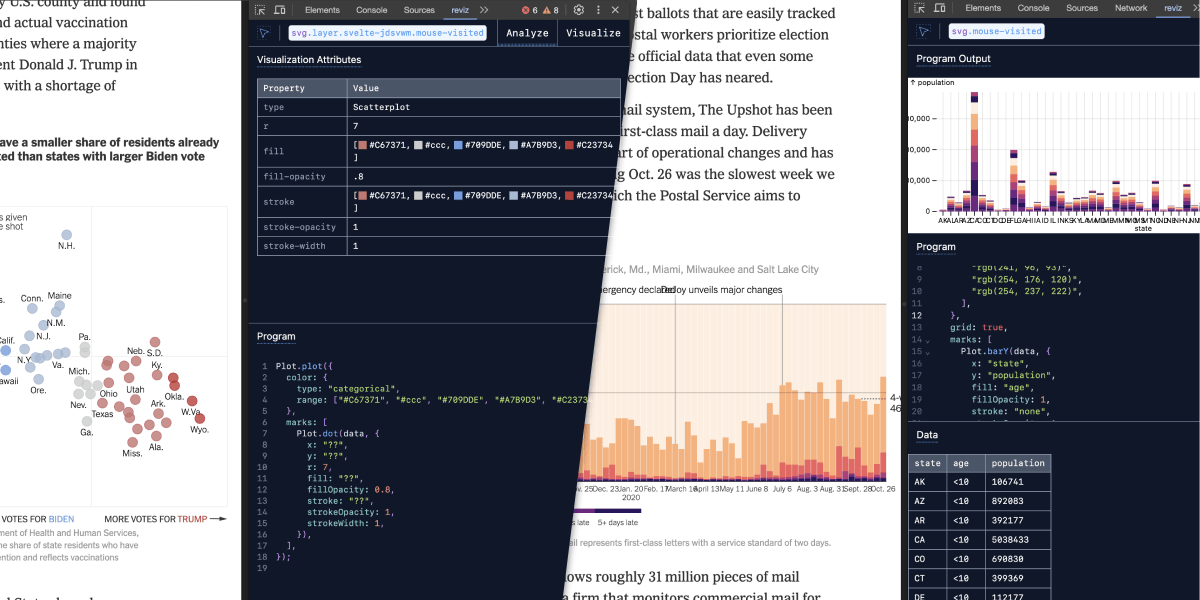
reviz Chrome Extension
The reviz Chrome extension brings the power of the reviz engine and compiler to your DevTools. Use the extension to turn any SVG visualization on the web into an Observable Plot program and accompanying visualization that you can edit, remix, and apply to new data.
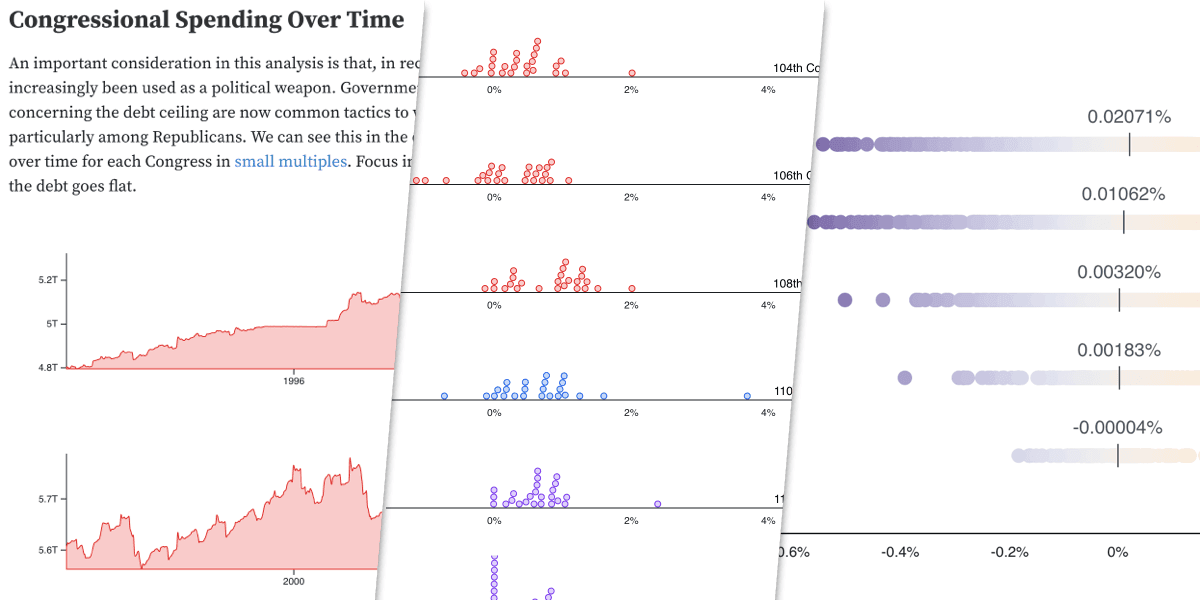
The National Debt
This collection of Observable notebooks explores patterns in the US national debt across Presidential and Congressional eras. Where did the debt originate from, how is it changing, and who is responsible?
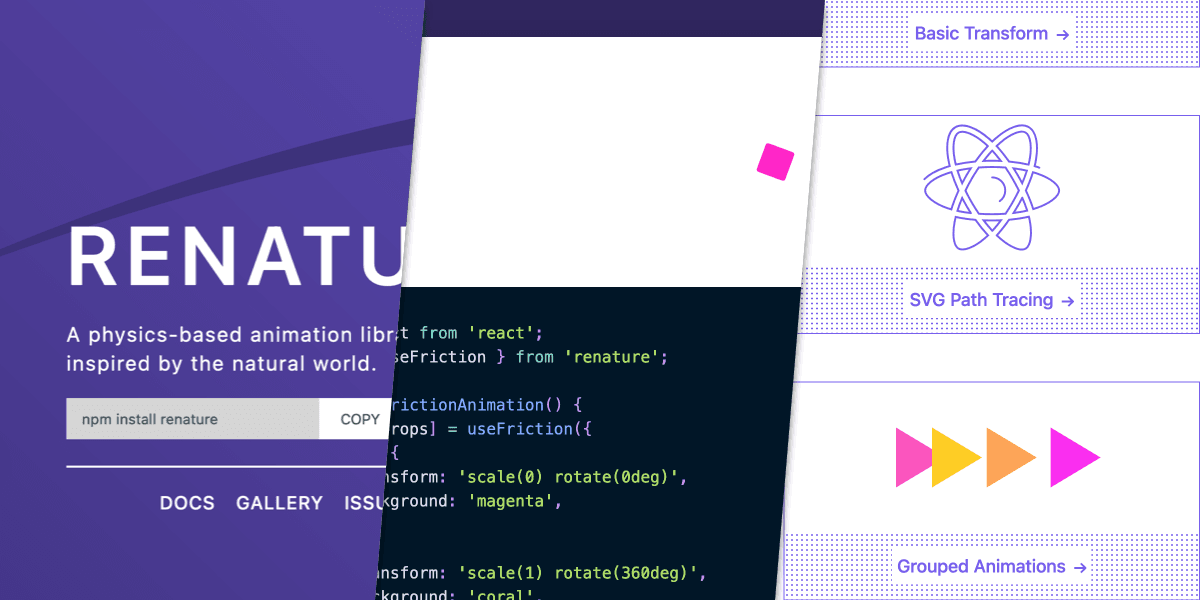
renature Docs Site
The documentation site for renature provides diagrams, live code editors, and an animation gallery to help users get started animating joyfully with this physics-based animation library for React.
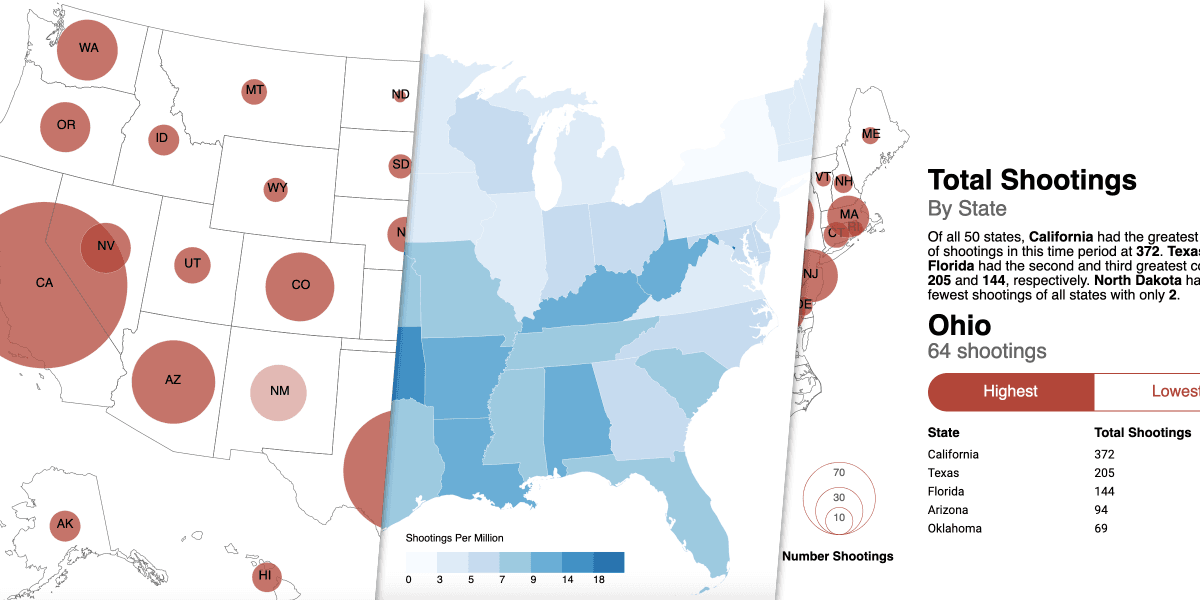
Police Shootings
This set of visualizations combines data from the Guardian and the 5-year American Community Survey (ACS) to better understand geographic and racial patterns in police violence in America.